
Children report improved relationships with staff
To download this information, click here.
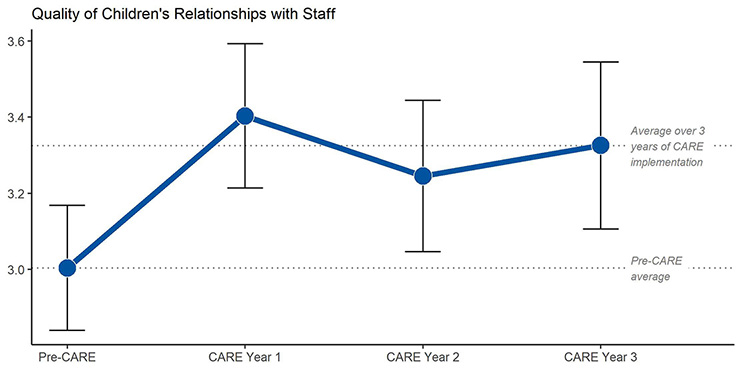
When CARE was implemented in 12 agencies, children reported an increase in the quality of their relationship with staff. The increase was larger for children with two or more previous placements, but did not differ by age, gender, race, length of stay, child welfare referral, extent of problem behavior, or the culture and climate of the organization. See Izzo et al., (2020) for a detailed report of these results.
Relationship quality was measured with four annual surveys asking children about their experience with direct care staff in their unit within the context of specific scenarios common in residential settings. Examples of the questions include “They notice when I’m upset,” “They were available to talk with me,” and “They showed me ways to calm down or feel better.” Children responded based on their experience during the last month using a 5-point scale (1=never to 5=always with 3=sometimes).The average length of stay was 7.8 months, so these analyses only include children (n = 592) who had not previously completed a survey.
Izzo, C. V., Smith, E. G., Sellers, D. E., Holden, M. J., & Nunno, M. A. (2020). Improving relationship quality in group care settings: The impact of implementing the CARE model. Children and Youth Services Review, 109, 104623.
Serious behavioral incidents decreased
To download this information, click here.
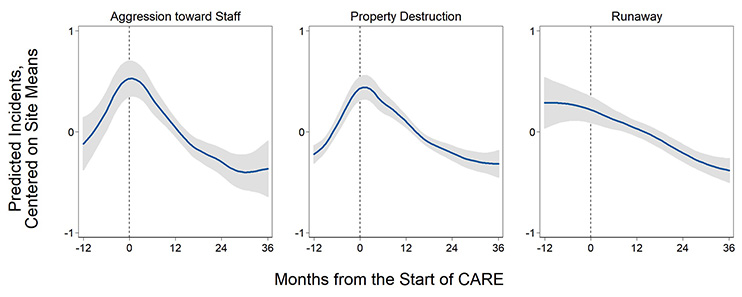
Across 11 agencies, the frequency of aggression towards staff, property destruction, and runaways decreased by four to eight percent per month as CARE was implemented. See Izzo et al. (2016) for a detailed report of these results.
Each of the agencies provided data on the monthly frequency of serious behavioral incidents and the number of children in residence that month. The trend in the number of incidents per child in the 12 months before CARE began (-12 to 0 on the figure above) was compared to the trend during the first 36 months of CARE implementation (0 to 36).
The zero on the Y axis represents each agency's overall average number of incidents per month across the entire 48-month study period. When the blue line is above zero, the predicted frequency of incidents is higher than average and when the blue line is below zero, the predicted frequency is below the average.
We examined each agency to understand the increasing trends observed during the year before the start of CARE and found increases in one to four of the 11 agencies, depending on the outcome. When we ran the analysis with these agencies removed, the decline in incidents during the implementation of CARE was still evident.
Izzo, C. V., Smith, E. G., Holden, M. J., Norton, C. I., Nunno, M. A., & Sellers, D. E. (2016). Intervening at the setting level to prevent behavioral incidents in residential child care: Efficacy of the CARE program model. Prevention Science, 17(5), 554-564.
Staff demonstrate greater knowledge of CARE concepts
To download this information, click here.
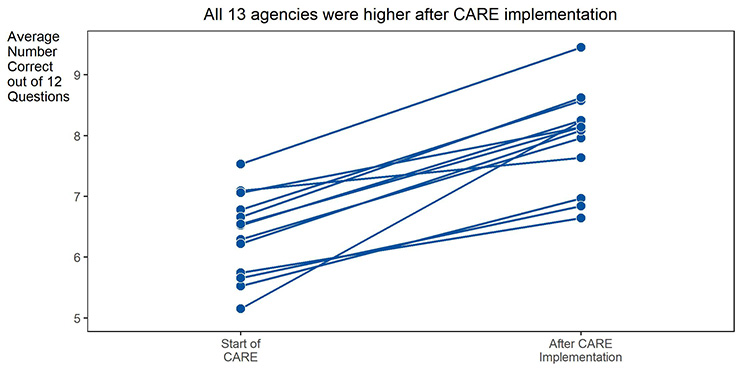
When CARE was implemented in 13 agencies, staff knowledge about CARE concepts increased in every agency. The increase was maintained after controlling for characteristics of the staff (e.g., education, job role, length of time at the agency), the culture and climate of the agency, and the study design. See Izzo et al. (under review) for a detailed report of these results.
Staff knowledge about CARE concepts was measured as the number of correct responses to 12 multiple choice questions in a survey administered at the start and after three years of CARE implementation.
Izzo, C. V., Smith, E. G., Holden, M. J., Norton, C. I., Nunno, M. A., & Sellers, D. E. (2016). Intervening at the setting level to prevent behavioral incidents in residential child care: Efficacy of the CARE program model. Prevention Science, 17(5), 554-564.
Staff endorse more CARE-consistent beliefs
To download this information, click here.
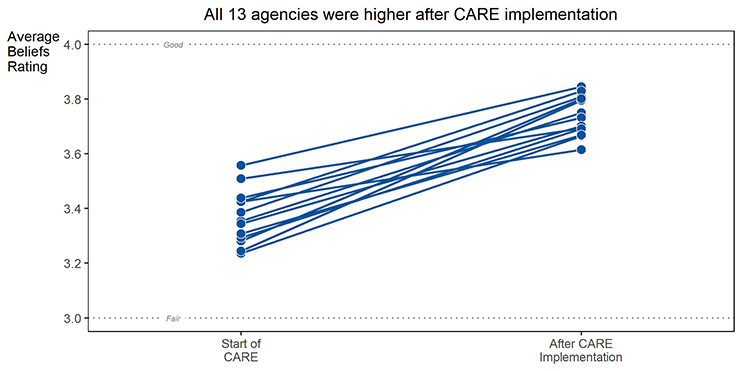
When CARE was implemented in 13 agencies, staff reported an increase in beliefs consistent with CARE. The increase in CARE-consistent beliefs was maintained after controlling for characteristics of the staff (e.g. education, job role, length of time at the agency), the culture and climate of the agency, and the study design. See Izzo et al., (under review) for a detailed report of these results.
Measuring CARE-Consistent Beliefs:
- The average response to 23 survey questions
- Higher Beliefs scores represent more CARE consistent beliefs
- 14 of the questions asked the staff member to rate, on a five-point scale from 1=very poor to 5=excellent, possible responses to four scenarios common in residential care (e.g,. child refusing to do homework, angry child screaming obscenities)
- 9 of the questions asked the staff member to rate their agreement (1=strongly disagree to 5=strongly agree) with more general statements about child care practices.
Izzo, C.V., Smith, E.G., Sellers, D.E., Holden, M.J., & Nunno, M.A. (under review). Promoting a relational approach to residential child care through an organizational program model: Impacts of CARE implementation on staff outcomes.
Staff reported more CARE-consistent practices
To download this information, click here.
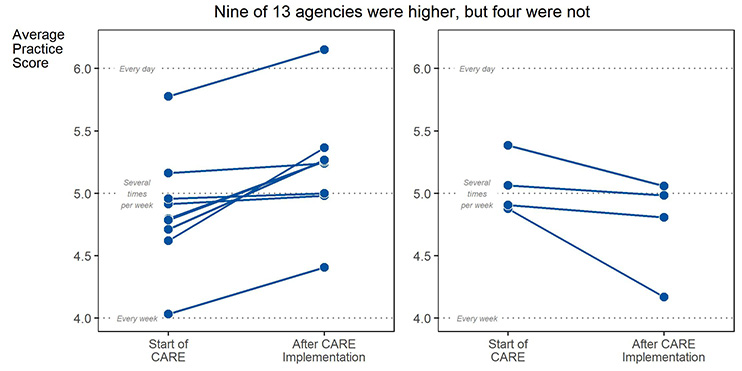
On average, direct care staff reported an increase in CARE-consistent practices, though this result was less consistent across the 13 agencies participating in the study. The increase in CARE-consistent practices was maintained after controlling for characteristics of the staff (e.g. education, job role, length of time at the agency), the culture and climate of the agency, and the study design. See Izzo et al., (under review) for a detailed report of these results.
To measure CARE-consistent practices, staff reported the frequency with which they engaged in 31 practices with children in the milieu over the past 30 days using a 7-point scale (1=never to 7=several times a day). Practice questions reflected the following aspects of a relational practice approach in residential settings:
- promoting a sense of relatedness and belonging (e.g., Spend time just socializing with a child when you could be doing something else),
- reading and responding to emotional needs (e.g., Encourage a child to talk with you when he/she is sad or upset),
- promoting competency development (e.g., Adjust the activity so that a child can be successful),
- supporting autonomy (e.g., Ask for a young person's input about expectations or rules), and
- preventing stressful situations for children (e.g., “Avoid activities or situations that trigger the child's stress response”).
Practice scores, which ranged from 1 to 7, were the average frequency rating across responses to the practice questions. Higher scores represent more practices consistent with CARE.
Izzo, C.V., Smith, E.G., Sellers, D.E., Holden, M.J., & Nunno, M.A. (under review). Promoting a relational approach to residential child care through an organizational program model: Impacts of CARE implementation on staff outcomes.

The studies providing the evidence-base for the CARE program model included the following components of strong research designs:
To download this information, click here.
- Many years of data: All studies included multiple years of data. In particular, the single agency time series analyses included at least 11 years of data.
- Multiple agencies: The primary study providing evidence of changes in staff knowledge, beliefs, and practices as well as child reported improvements in their relationships with staff and the number of serious behavioral incidents included at least 11 agencies. A separate study of one agency over 12 and 11 years provided evidence of a decrease in the use of physical restraints and psychotropic medication, respectively.
- Statistical controls: Analyses of staff and child outcomes included controls for characteristics of the child, the staff, and the agency as well as the study design (e.g., nesting of observations within agency and cohort).
The results obtained in the studies providing the evidence-base for the CARE program model are consistent across:
To download this information, click here.
- Theory of change and outcomes: The results obtained aligned with those expected based on the Theory of Change for the CARE program model.
- Child, staff, and organizational outcomes: The direction of changes in staff knowledge, beliefs and practices aligned with the results detected in reports from children as well as from data maintained in administrative records (i.e., behavioral incidents, use of physical restraints, use of psychotropic medication).
- Multiple agencies: The changes reported after implementation of the CARE program model were consistent across as many as 13 agencies.
- Multiple study designs: The results obtained in different study designs were consistent.
Decreases use of physical restraints
To download this information, click here.
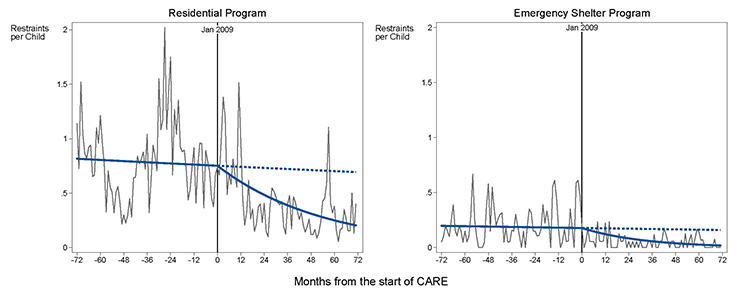
The use of physical restraints decreased in both a residential and an emergency shelter program for six years after the start of CARE implementation in one agency. See Nunno et AL. (2017) for a report of the impact of CARE implementation on the use of restraints.
The light gray line connects the average number of restraints per child per month which was calculated for each month by dividing the number of physical restraints by the number of children in care. The vertical line at 0 represents the start of CARE implementation. The trend in the use of physical restraints before and after CARE implementation is represented by the solid dark line. The dotted line after the start of CARE represents the expected trend without the CARE intervention. The difference between the dotted line and the dark line after the start of CARE represents the dramatic, statistically significant decrease in the use of physical restraints.
Nunno, M. A., Smith, E. G., Martin, W. R., & Butcher, S. (2017). Benefits of embedding research into practice: An agency-university collaboration. Child Welfare, 94(3), 113–133.
NOTE: This article is not open access. Child Welfare does not allow open access. The figures convey the same results, they are not the same as any figure in the paper.
Decreases use of psychotropic medication
To download this information, click here.
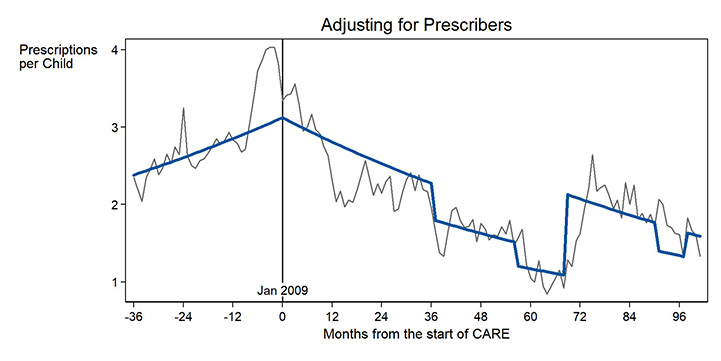
The use of psychotropic medication decreased for eight years after the start of CARE implementation in a single agency. See Smith et al. (2019) for a detailed report of these results.
In this figure summarizing an interrupted time series analysis at one agency, the light gray line connects the average number of psychotropic medication prescriptions per child per month, which was calculated by dividing the number of prescriptions per month by the number of children in care. The vertical line at 0 represents January 2009, the start of CARE implementation. The dark line represents the trend before and after the start of CARE, after adjusting for who was prescribing medications at each month.
Smith, E.G., Nunno, M.A., Martin, W.R., & Sellers, D.E. (2019, April). Does the CARE Program Model Reduce Use of Psychotropic Medications in Residential Care? Poster presented at the 63rd Annual Conference of the Association of Children’s Residential Centers, New Orleans, LA.
In 2017, CARE was listed on the California Evidence-Based Clearinghouse with a Level 3 Scientific Rating and High Child Welfare Relevance. This section describes the results, including outcomes at the child, staff, and organizational levels, which support the Level 3 Scientific Rating. Results are listed by type of outcome (e.g., child, staff). Click on a result to get more information.
Publications Describing the Impact of the CARE Program Model
Izzo, C. V., Smith, E. G., Holden, M. J., Norton, C. I., Nunno, M. A., & Sellers, D. E. (2016). Intervening at the setting level to prevent behavioral incidents in residential child care: Efficacy of the CARE program model. Prevention Science, 17(5), 554-564.
Nunno, M. A., Smith, E. G., Martin, W. R., & Butcher, S. (2017). Benefits of embedding research into practice: An agency-university collaboration. Child Welfare, 94(3), 113–133.
Smith, E.G., Nunno, M.A., Martin, W.R., & Sellers, D.E. (2019, April). Does the CARE Program Model Reduce Use of Psychotropic Medications in Residential Care? Poster presented at the 63rd Annual Conference of the Association of Children’s Residential Centers, New Orleans, LA.
Izzo, C. V., Smith, E. G., Sellers, D. E., Holden, M. J., & Nunno, M. A. (2020). Improving relationship quality in group care settings: The impact of implementing the CARE model. Children and Youth Services Review, 109, 104623.
Izzo, C. V., Smith, E. G., Sellers, D. E., Holden, M. J., & Nunno, M. A. (2022). Promoting a relational approach to residential child care through an organizational program model: Impacts of CARE implementation on staff outcomes. Children and Youth Services Review, 13, 106330.
 |
 |
 |
 |
 |
 |
 |
 |
 |
 |
 |
©2021 Residential Child Care Project, Cornell University, Ithaca, New York USA